
When I started with technical trading, I felt like entering the medieval alchemist scene. A multitude of bizarre trade methods and hundreds of technical indicators and lucky candle patterns promised glimpses into the future, if only of financial assets. I wondered – if a single one of them would really work, why would you need all the rest? And how can you foretell tomorrow’s price by drawing circles, angles, bats or butterflies on a chart?
There is no real answer, as the inventors of those methods usually forgot to mention – aside from some vague financial verbiage – how and why they are supposed to work, and which market pattern or inefficiency they are supposed to exploit. Often the methods are merely recipes to be followed meticulously, like the spells in ancient conjuring books. Superstition and esotericism in financial trading are approved by seemingly serious organizations such as the Market Technicians Association, and even trained in their certification programs! Here’s a certainly non-complete list of ways of trading that I still fail to understand.
- Staring at Price Curves. Opening and closing positions manually without a trading system can work. When you have some information about the particular asset that the other traders don’t have. Or when you got a stroke of luck. Otherwise you can rightfully expect to lose your money at the rate of the transaction costs. In reality it’s even worse – private traders lose on average 13 pips per trade, according to FXCM statistics. The human mind can do a lot of things, but it can not identify a market inefficiency by looking at a price curve. Studies have shown that ‘expert traders’ can not even distinguish real price curves from meaningless random numbers – something even a simple computer algorithm has no problem with. And as to luck, it indeed endows about 35% of private traders every year with some profit or at least no loss, but it has one problem: it can end anytime.
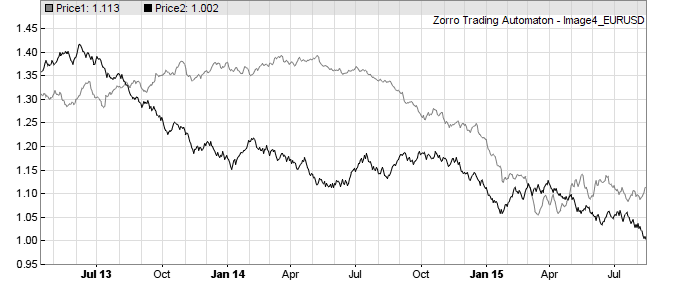
Which of the two price curves is real? - Technical Analysis. Do traditional ‘technical indicators’, such as MACD, Stochastic, Ichimoku etc., really work? A study by David Aronson, described in his “Evidence-Based TA” book, suggests otherwise. None of the studied basic indicators was any better than throwing a coin. However, the study only applied the indicators to the S&P500 index. The trend experiment suggests that this index is the least predictable of the tested asset types, at least for short-term trend following. Also, Aronson only tested the basic indicators, but not complex combinations of them. So it’s still unknown whether traditional indicators do sometimes work, or not at all. And as long as this is the case, it’s not clear to me why they are so widely and naively used.
- Elliott Waves. Ralph Nelson Elliott claimed in his 1938 published book that the prices of financial assets always move up and down in a fractal pattern of five waves. He gave many examples. And indeed you can see all sorts of waves when you stare at curves long enough. Elliott explained his waves with “mass psychology”, but was not interested in going into details. Although cycles in price curves are real, they have no reason to appear in series of five, or in any series whatsoever. Lacking any rational background, one should think that there was at least some statistical evidence of Elliott Waves – but no. No serious research has ever found any sign of them in real price curves, nor of the countless wave variants invented by Elliott’s many imitators.
- Gann Magic. In the early 20th century, the trader William Delbert Gann was desperate, as he could not support his family with his trading.
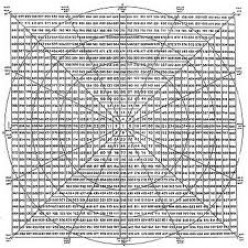
Gann’s Magic Square But suddenly he discovered the way to success: Planting anecdotes that promoted himself as a genius trader, and selling esoteric trade systems and books. It seems that Gann was the ancestor of all scammers in the trading scene. He did not die rich, though, as in his late years he apparently began to believe in his own methods. He lost at the stock market almost all wealth he accumulated by marketing his methods. I know of no tests that found any value in his magic squares, lines, cycles, pyramids, or angles. But even today, many traders still believe in them, to the great joy of their brokers.
- Astrology. It’s widely accepted as a normal trade method and discussed in many trading books. Even Perry Kaufman, in his standard reference of trading systems, published code to calculate the Jupiter-Saturn cycle! Indeed, trading would be a breeze if you could calculate tomorrow’s prices just from the positions of sun, moon, and planets. But sorry, Perry: Celestial bodies still stubbornly refuse to predict earthly events. No test ever confirmed a correlation of the full moon and the EUR/USD price. Neither was Saturn ever observed dragging down the S&P500 index. And contrary to popular belief, even the sun is not responsible for the change of seasons (it’s the tilt of the earth axis). As long as we got no interstellar stock exchange, trading still happens on earth.
- Rice Candle Patterns. With names like “Three Stars in the South” or “Concealing Baby Swallow”, they bring at least some poetry into trading. Candle patterns had been developed in the 18th century by Japanese traders for predicting the local rice markets. And indeed they might have had some value back then. But even today many traders are still squinting at price charts, hoping for a lucky trade when a candle formation matches a bullish pattern in their “Get Rich with Candle Patterns” book. The TA-Lib fortunately contains indicators of all those patterns, so I could run quick tests of them with several assets, similar to the trend indicator test. You can imagine the result. – By the way, new patterns invented by trade book authors – “Lizard’s Day”, “Gilligan’s Island” etc. – didn’t fare any better.
- Fibonacci Numbers. This simple number series – 1, 2, 3, 5, 8, 13, etc. – can be found in some patterns of geometric growth. But there’s no reason to expect it in the price levels or time periods of financial assets. And indeed, it isn’t there. As far as I know, no one has ever discovered any price series property related to Fibonacci Numbers, or to Golden Ratios, Golden Squares, or Golden Whatevers derived from them. Nevertheless traders seem to like the word “Fibonacci”, maybe because it lets them imagine that they apply serious math. When a system uses Fibonacci Numbers for trade signals, you can safely assume that it would also work, and most likely better, with any other numbers.
- Harmonic Trading Patterns. By connecting pivot points on the price curve, you can produce funny polygonal figures such as diamonds, butterflies, crabs, or bats. Their shapes predict profitable trade entry points. Or do they? I don’t know – I admit I have not yet tested a system based on trade predictions by polygonal figures. I’m only sure that harmonic trading is profitable for the tool and seminar vendors who promote it.
- Your Trading Style. In trading books you’ll often read advices like ‘place the stop loss at a distance that suits your trading style‘. This makes you wonder what Your Trading Style might be. Do you trade fast, slow, risky, greedy, or in the style of the Kamikaze? And should this style affect the distance of the stop loss? I think not. Since any parameter in a trade system has an optimal or most robust value, any other value will therefore produce a less than optimal result. If it suits your style to win rather than lose, better select your trade methods and parameters not by style, but by performance.
- Your Trading Plan. You trade for increasing your fortune in three years from $5000 to $500,000. So you’ve created a detailed plan by which percentage it has to grow every week. Fortunately, it’s just 3%. Unfortunately, the markets could not care less about Your Trading Plan. And if you’re following some system, your wins and losses will often have serial correlation. So when you continue trading after a loss until you reached your weekly goal, usually only your loss will grow. And the initial $5000 will become zero dollars – not in 3 years, but much faster.
- The Holy Grail. On any trader forum you’ll find some lengthy thread about a system with miraculous profits. The thread starter has discovered the ultimate trade method. He feeds the thread periodically with reports of his impressive trade results – such as, doubling his account every month – and vague hints about his miracle algorithm and its complex math. His devotees eagerly absorb any droplet of information in their attempts to replicate the trade method – but alas, some essential ingredient is always missing. Miracles have the nasty habit of disappearing at closer look. The thread will eventually dry out when either the miraculist got broke or when the last follower has realized that he was following a Fata Morgana. If you found a miracle method where this did not happen, please let me know!
- Robots. They are offered by anonymous vendors on countless websites. And supported by likewise anonymous users that all claim on trader forums that they have earned millions with that particular robot. Theoretically, a correctly developed and tested robot could indeed work, if algorithmic trading works at all. But apparently none is offered for sale. The simplest way to sell robots is offering a free trial period: When trades are entered at random, about 55% of users will lose during that period and 45% will win. Those will then order the robot – at least that’s the vendor’s hope.More sophisticated robot vendors provide faked trade histories or even faked live trading equity curves, like this one:
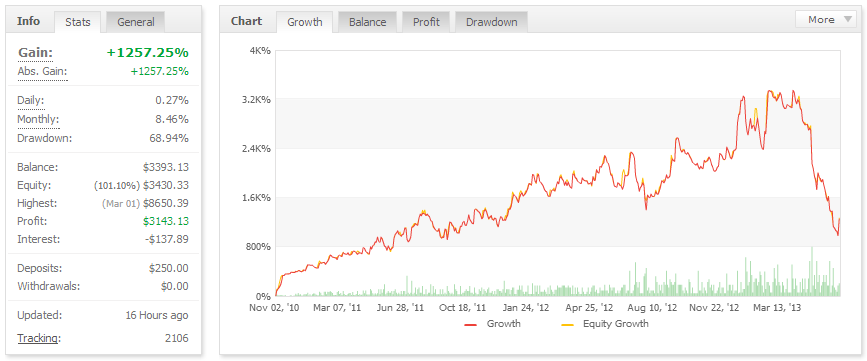
Typical robot equity curve Can you see from the above curve when this robot started selling? Hint: It’s close to the end. How to program a scam robot with an impressive faked equity curve on a verified MyFXBook™ account is explained in this book (of course for educational purposes only!). But if you ever encounter a real person who really made money by buying such a robot, please notify me…
- Book systems. There are countless books describing countless trade systems – and certainly not all of them are garbage. But amazingly, many of the described systems survive not even a simple backtest. Their authors often suspect this already. That’s why some – for instance, best selling trade book writer Thomas Carr – warn strongly against testing their systems because “backtests are useless anyway”. This is correct – insofar as a positive backtest does not prove that the system works. But a negative backtest means that the money you paid for the book will be the least of your worries when you really trade one of the praised systems. Almost 90% of all systems from books, forums or websites that I’ve tested were clear losers – and this could often be determined in 5 minutes.
- Trade Copy Services. The best-known is Zulutrade®, but many competitors have meanwhile entered this lucrative business. The principle is always the same: Let others place your trades. Follow successful traders and copy their trading. A brilliant idea. If those successful traders really existed. And indeed, you seem to have plenty of choice on the service’s website. Select some of the Top Traders with 500% profit and impressive equity curve, place an investment, and wait for the money to roll in. After a while you will inevitably find that it rolls in the other direction. One after the other of your selected Top Traders will encounter a nasty drawdown, just after you started following them. And their equity curves now all look like the robot curve above. Damn bad luck! – Or is anything else behind it?
Behind it is no scam, but simple statistics. Thousands of traders compete for followers on copy services. In the Top Traders list you’ll only find those who trade risky but had a stroke of luck so far. Because luck does not last, the Top list is changing permanently. A trader’s survival time in that list is a few weeks, maybe months – then his fortune takes a dip, and takes all his followers with it. The trader won’t mind. He just opens a new account under a new name. He has earned considerably more follower commission than he lost with his trading. Tip: Look not into the Top Traders, but into the Top Followers list (if the service dares to publish one). That might tell you something about the chance of keeping your money when copying trades.
- Martingale or d’Alembert Methods. They are used by many trading robots, signal providers, and beginners in roulette: you bet on red or black and double your stake after every loss. Alternatively, you open two new positions for every lost trade. The theory is that a loss increases your win chance the next time. Unfortunately, it won’t. On the contrary, market inefficiencies can be autocorrelated, so after losing a trade there’s a good chance that you’ll also lose the next one. Although martingale systems at first seem to make steady profits – even when trades are entered at random – they will encounter a long loss streak sooner or later and wipe out the account.
How long will it take until this happens? Assume that you invest 1% of your capital per trade. After a loss you double your investment: 2%, 4%, 8%, 16%, 32%… and the sixth loss will empty your account and cause a margin call. With 50% win rate and uncorrelated returns, the probability of 6 consecutive losses is 0.5 6 = 0.015625. The probability of this event not happening in n trades is (1-0.015625) n, so the number of trades until the margin call probability exceeds 50% is log(0.5)/log(1-0.015625) = 44. With one trade per day, your account will last about 2 months. A higher win rate, like 90%, won’t help – the average loss is then normally also 9 times higher, so the account lifetime is still the same 2 months. Investing only 0.1% instead – $10 per $10,000 capital – would extend the average account survival time to about 17 months. - Deadly Accuracy. A 99% win rate is easy – just use a 5 pips profit target and a 500 pips stop loss distance. You’ll then probably win the next 99 trades, regardless of your strategy, and will be worshipped as a god on your trader forum. Unfortunately the 100th trade will hit the stop and eat up all profit. Even worse, that fatal trade can happen anytime, even right at the beginning. You can easily identify scammers that use a high win ratio for selling their systems: their published profit curve looks like a straight upwards slope, with any trade winning about the same small amount. They usually disappear when hit by the 100th trade.
- Grid trading. Such a system is a special case of using a high win ratio, up to 100%. It opens many trades at a fixed price grid, and takes profit when the price crosses the next grid line. This method can indeed generate a stream of profits for a while when the prices move up and down, but don’t move too far away from their initial position. Problem is that they eventually do… How much capital would you need for a grid trader to survive such a price move?
Assume that you have n open trades and the price moves by x pips, x being much larger than the grid size. The move will then increase the balance by x pips and reduce the open trade value by about n/2 * x pips, causing an overall equity drawdown of (n/2-1) * x pips. On a Forex account with 10 mini lots trade size, 1 $ pip cost, and an average of 20 open trades, a 500 pips (5 cents) price move produces a 9*10*500*1$ = 45,000 $ drawdown. Such moves can occur several times per year. More capital and smaller trade sizes can delay, but not avoid that event.
It’s easy to tweak grid trading systems for surviving any backtest, so they are often found in trade robots and on trade copy services. There are few exceptions where grid trading can make sense – for instance when runaway prices are hedged with some method, or when the price movement is limited by external factors such as a price cap.
Looking at all those methods it seems not really surprising that most traders lose money. But maybe I’m mistaken – if you have some solid evidence that one of the above methods does in fact work, please let me know!
Just found your blog. Congrats, it’s amazing! I am unsure about a sentence on item #1:
<>
How could you tell a randomly generated price curve from a real one?
Oops! I tried to enclose the quote in “<>” characters and it seems that the blog content system did not like it. Let me paste it here: ‘expert traders’ can not even distinguish real price curves from meaningless random numbers – something even a simple computer algorithm has no problem with”
There are many methods for a computer algo to detect a real price curve, the simplest is just counting the sequences of rising and falling bars. In a real price curve you have less up-down or down-up sequences as in a random walk curve, but more up-up and down-down sequences. Here’s a statistic:
Red is real, blue is random. The height of the bars is the count of sequences of rising or falling prices with their lengths on the x axis. These differences between real and random sequences appear in most markets and time frames.
A similar method is the MMI. Random data has a MMI of 75%, anything significantly less than 75% is a real curve.
I think there’s survivorship bias in some of the strategies you’ve listed. We likely hear about Gann or Elliot Waves because it seems to have worked for some trader in the past and they publish a paper or book on it that gets a lot of attention. Most people will try these strategies – if they work, they publish more praise for it; if they don’t, they blame something else – and this further perpetuates it. Relatively few people will actually do a study and verify the claims made by that particular technical trading strategy.
There’s definately a great deal to know about this subject.
I like all the points you made.
When I first started investigating trading I was similarly bemused as you were with all these systems. Unfortunately to get to the point where you know which are rubbish and which are not required a lot of reading, testing and wasted time. It is very nice to see a summarized list of what took so much study to know! Great work.
Let alone that most of the strategies you mentioned (Fibo, Gann…) are self-fulfilling!
Thanks for the great work and sharing
sometimes it is better to be lucky than smart : Paul Tudor Jones made millions in the crash of 87 using elliott wave theory!
Dude your blog is awesome, im stating with zorro, thanks for sharing your toughts in such a organized way, its really hard to find common sense and reason on this FX trading thing.
I have just started to try trading. But one question from my side. If we combine two or three techniques which you have mentioned and then take the trade. Is the probability of winning the trade not high?
I don’t know since I am not using those methods, but would strongly suspect that combining two or three bad techniques produces an even worse technique.
Many different traders encourage you to develop a strategy that works for you, and to stick to it, but they all leave some place for gut feeling. In other words, almost any system can work provided you practice it enough to get an intuitive feel for the situations in which it won’t work.
Obviously that is going to be hard to code into an algorithmic approach.
Good stuff and an excellent blog. Even long term stock index holding is fraught with difficulty however. Argentina, Germany and Russia looked excellent bets in 1900. Look what happened a few years later. After over 30 years in markets my conclusion is that unless you are “earning” (front running, arb, bid/offer spread or other) all forms of trading and investing require as much luck as skill.
The US equity markets have returned (?) 8 or 9% in non inflation adjusted returns for over 100 years but can you forecast the next 100? My own answer to that would be “no”. Long term therefore the only “investment” approach likely to “succeed” is wide diversification over global economies and markets. The only “trading” enterprise likely to succeed is one where you have a built in source of real earnings rather than relying on ephemeral and ever changing patterns.
And as for machine learning no one has yet decided we live in a deterministic universe or whether time actually exists or not. And even if strict determinism rules chaos theory suggests successful prediction may still prove unattainable.
Which is why so many people sell something rather than trade. Or offer some sort of service: brokers commissions, the bid/offer spread, research…whatever
And indeed all the methods you review above are pure moonshine. Although moving average crossovers have been/ were/ are used by many for trend determination.
Great content, Sir! This is one of the few places where I found the truth about the trading business.
Technical Analysis & Geometry wears who don’t know it.
Think outside your prejudice.
What about Tarot? I’ve seen that too.
I do not agree, it seems that you have forgotten why the price moves, the price moves due to an imbalance between the supply and demand of an asset, and the volume delta tells you at all times whether the ask or bid is in control.
That supply and demand can be unreal or fictitious? Of course yes
Is there any data that is not altered or modified in the markets?
There’s certainly no problem with supply-demand imbalances or volume deltas.
Thanks for this, it’s hilarious! Even if I wasn’t interested in trading, I’d probably keep reading.
If you wanted a different challenge, write a comedy using these ideas. It could really fly.
Heck, write the novel and I’ll adapt it for film! Yes, I’m an amateur screenwriter.
Although that’s just one more prediction, and the film biz is also hopeless at those.
William Goldman, a two time Oscar winning screenwriter once said:
Nobody knows anything.
i.e. Hollywood always has a hard time figuring out how to make profitable films.
Anyway, please do keep writing, I love a good laugh!
I was directed here from an email telling about a new successful Zorro grid system method. While I agree there’s a huge mass of untested junk, as Dylan said, “Don’t criticize what you can’t understand.” Or in this case, test for yourself. If bizarre is a qualification for dismissal, quantum mechanics is also a joke. So far Einstein is losing on that score.