
The more data you use for testing or training your strategy, the less bias will affect the test result and the more accurate will be the training. The problem: price data is always in short supply. Even shorter when you must put aside some part for out-of-sample tests. Extending the test or training period far into the past is not always a solution. The markets of the 1990s or 1980s were very different from today, so their price data can cause misleading results.
In this article I’ll describe a simple method to produce more trades for testing, training, and optimizing from the same amount of price data. The method is tested with a price action system based on data mining price patterns.
The price curve is normally divided into equal sections, named bars. Any bar has an associated candle with an open, close, high, low, and average price which are used by the system for detecting patterns and generating trade signals. When the raw price data has a higher time resolution than a bar, which is normally the case, the candle prices are sampled like this:
Open ~=~ y_{t-dt}
High ~=~ max(y_{t-dt}~...~y_t)
Low ~=~ min(y_{t-dt}~...~y_t)
Close ~=~ y_t
Avg ~=~ 1/n \sum_{t-dt}^{t}{y_i}
where yt is the raw price tick at time t, and dt is the bar period. If we now subdivide the bar period into m partitions and resample the bars with the time shifted by dt/m, we can produce m slightly different price curves from the same high resolution curve:
Open_j ~=~ y_{t-j/m dt-dt}
High_j ~=~ max(y_{t-j/m dt-dt}~...~y_{t-j/m dt})
Low_j ~=~ min(y_{t-j/m dt-dt}~...~y_{t-j/m dt})
Close_j ~=~ y_{t-j/m dt}
Avg_j ~=~ 1/n \sum_{t-j/m dt-dt}^{t-j/m dt}{y_i}
m is the oversampling factor. The price curve index j runs from 0 to m-1. Any curve j has obviously the same properties as the original price curve, but has slightly different candles. Some candles can even be extremely different in volatile market situations. Testing a strategy will thus normally produce a different result on any curve.
Time series oversampling can also can also be used with price-based bars, such as Renko Bars or Range Bars, although the above equations then change to the composition formula of the specific bar type. I found that the profit factors of strategies can differ by up to 30% between oversampled price curves. A large variance in results hints that something with the strategy may be wrong – maybe it’s too sensitive to randomness and thus subject to improvement. A strategy that produces large losses on some curves should better be discarded, even if the overall result is positive. But you can safely assume that live training results are best represented by the worst of all the oversampled price curves.
Price action example
Time series oversampling is supported by the Zorro platform. This allows us to quickly check its pros and cons with example strategies. We’ll look into a simple price action strategy with candle patterns. This is a strategy of the data mining flavor. It is not based on a market model, since no good model can explain a predictive power of candle patterns (if you know one, please let me know too!). This trading method therefore has an irrational touch, although it’s said to have worked for Japanese rice traders 300 years ago, maybe due to trading habits or behavior patterns of large market participants. Whatever the reason: while trading the old rice candle patterns in today’s markets can not be really recommended, tests indeed hint at a weak and short-lived predictive power of 3-candle patterns in some currency pairs, such as EUR/USD. The emphasis is on short-lived: Trading habits change and thus predictive candle patterns expire within a few years, while new patterns emerge.
Here’s the Zorro script of such a strategy. In the training run it generates trading rules with 3-candle patterns that preceded profitable trades. In testing and live trading, a position is opened whenever the generated rule detects such a potentially profitable pattern. A walk forward test is used for curve fitting prevention, which is mandatory for all data mining systems:
function run()
{
  BarPeriod = 60; // 1-hour bars
  set(RULES+ALLCYCLES);
  NumYears = 10;
  NumWFOCycles = 10;

  if(Train) {
    Hedge = 2;	  // allow simultaneous long + short trades
    Detrend = TRADES; // detrend on trade level
  } else {
    Hedge = 1;	// long trade closes short and vice versa
    Detrend = 0;
  }

  ExitTime = 4; // 3 hours trade time
  if(between(lhour(CET),9,13))  // European business hours
  {
    if(adviseLong(PATTERN+FAST+2,0, // train patterns with trade results
      priceHigh(2),priceLow(2),priceClose(2),
      priceHigh(1),priceLow(1),priceClose(1),
      priceHigh(1),priceLow(1),priceClose(1),
      priceHigh(0),priceLow(0),priceClose(0)) > Limit)
        reverseLong(1);

    if(adviseShort() > Limit)
      reverseShort(1);
  }
}
The core of the script is the adviseLong/adviseShort call, Zorro’s machine learning function (details are better explained in the Zorro tutorial). The function is fed with patterns of 3 candles; the high, low, and close prices of adjacent candles are compared with each other (the open price is not used as it’s identical to the previous close in 24-hour traded assets). Training target is the return of a 3-hours trade after the appearance of a pattern. We’re using 3 hours trade time because the patterns consist of 3 bars, and it makes some sense to have a prediction horizon similar to the pattern length. Since we’re trading EUR/USD, we’re limiting the trades to European business hours. So the last trade must be entered at 13:00 for being closed at 16:00.
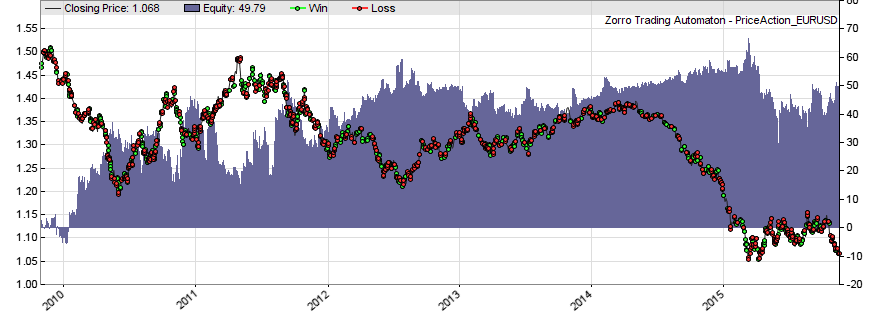
But when we train and test the above script with EUR/USD, we get no profitable strategy – at least not with realistic trading costs (an FXCM microlot account is simulated by default):

We can see that the script seems to enter trades mostly at random, so the equity drops continuously at about the rate of the trading costs. The script performs a 10-years walk-forward test in 10 cycles. The default training/test split is 85%, so the test time is about 9 months after a training time of 4 years. 4 years are roughly equivalent to 4*250*24 = 24000 patterns to check. That’s apparently not enough to significantly distinguish profitable from random patterns.
The problem: We can not simply extend the training time. When we do that, we’ll find that the result does not get better. The reason is the limited pattern lifetime. It makes no sense to train past the half-life of the found patterns. So this is not the solution. But what happens when we train and test the same strategy with 4-fold oversampling?
NumSampleCycles = 4;
When we add this line to the script, the training process gets four times more patterns. Although many of them are similar, the amount of data is now enough to distinguish profitable from random patterns with some accuracy. We can see this in the now positive P&L curve over the likewise extended test periods:
I’ve added the above script to the 2015 repository. But although it generates some profit, be aware that it’s for demonstration only and no ‘industrial quality’. Sharpe ratio and R2 are not good, drawdowns are long, and essential ingredients such as stops, trailing, money management, portfolio diversification, filters, and DMB measurement are not included. So better don’t trade it live.
Conclusion
Admittedly the price action system is a drastic and somewhat dubious example of the benefits of oversampling. But I found that 4-fold or 6-fold oversampling improves optimization and training of almost all strategies, and also increases the quality of backtests by making them less susceptible to extreme candles and outliers.
Oversampling is certainly not the one-fits-all solution. It will not work when the system relies on a specific time for opening and closing trades, as for gap trading or for systems based on daily bars. And it does not help either when single candles have little effect on the result, for instance when trade signals are generated from moving averages with very long time periods. But in most cases it noticeably improves testing and trading.
Good to know that there is another tools for price pattern trading, but how does the Zorro method differ from the existing tools? Like Kantu, StrategyQuant, Price Action Lab?
The patterns are the same, differences are mostly speed and test methods. AFAIK pKantu is so far the most advanced price pattern detector, it uses the GPU for speed and supports parallel cloud mining. Zorro is probably the most flexible, as it detects patterns by many criteria, even with fuzzy logic. Price Action Lab is outdated and not in the same league as the other tools. I have not tested StrategyQuant, but it looks quite ok from the description. The funny thing is that they posted live trading results for some time, but now seem to have removed that from the website because all the accounts ended up with losses.
I believe price action trading can work in some situations, but there is not much profit to gain, except maybe for tool vendors. Closest to success is probably Daniel Fernandez with pKantu and his QuriQuant service, but even his results are not convincing.
nice article, but I got errors during compilimg. Ciao
oversample compiling………..
Error in ‘line 24:
‘Limit’ undeclared identifier
Limit)
>.
Use the PriceAction.c script from the 2015 scripts archive. The code snippets posted in articles are not the whole script, but only the main part, without global variables and definitions. The full script is in the repository.
Hi JCL, thank you for a great article. How would you implement oversampling with Range bars? You mention this is possible in the article. I tried simply to pick different start times for the time series, but that does not work – the bars revert to the same values a few bars after the start. Thanks!
For range bars, you must oversample not with a time offset, but with a price offset. The principle is the same. Subdivide the bar range in several equal partitions and sample the bars into ranges that are shifted by the partition size.
Looks promising.. Is there any way to get this work out on pinescript?(tradingview)
Possibly, but I’m not familiar with pinescript. It depends on wether it allows user-defined bars or not.
Hi jcl,
Have you ever tried to use patterns as an input filter and not as an input setup, in my experience I have seen that they can improve the equity curve. For example, a volatility compression pattern seems to increase performance in a breakout strategy, what do you think?
Yes, we had strategies with volatility patterns as filters, and I can confirm your observation that they usually increase the performance.