We will now repeat our experiment with the 900 trend trading strategies, but this time with trades filtered by the Market Meanness Index. In our first experiment we found many profitable strategies, some even with high profit factors, but none of them passed White’s Reality Check. So they all would probably fail in real trading in spite of their great results in the backtest. This time we hope that the MMI improves most systems by filtering out trades in non-trending market situations.
900 systems experiment revisited
I have been informed by readers that I committed two mistakes, or at least inaccuracies, in the previous experiment. First, I didn’t detrend the price data. Second, I used the equity curves instead of balance curves for determining the profit factor. I didn’t detrend the prices because the systems traded long/short in a symmetric way, and I supposed that this would eliminate any trend bias. But even if this was true back then, it is now not true anymore: filtering trades by MMI or other means can introduce asymmetry. Also, calculating the profit factor from the balance curve makes indeed more sense because you’re interested in the end profit of the trades, not in their interim behavior. Therefore and for the sake of comparable results I will now and in the future use detrended trade returns and balance curves for such experiments.
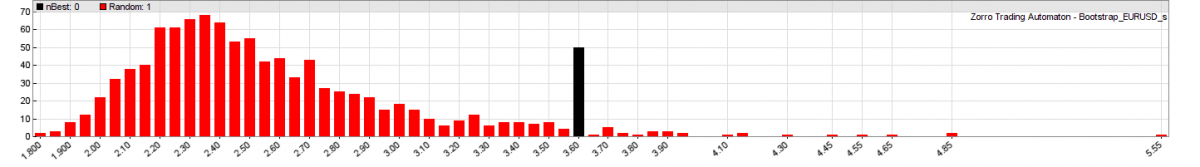
The original test, repeated with the modifications, produced a wider profit factor distribution due to eliminating intermediate returns. But the outcome of the experiment was the same. The statistic (including trade costs) did not change much, however the profit factor distribution (without trade costs) did. This is the new WRC histogram of the original 900 systems (best system vs. bootstrap-randomized returns of all systems):

Although the best system (black bar, a system using ALMA) is at the right side of the distribution, still 11% of random systems were better. The system does not pass the WRC at the required 95% confidence level. This turned out very different when filtering trades with the MMI.
The MMI experiment
This is our script TrendMMI.c for the new experiment:
// helper function: remove systems that exceed the 4 months lookback period
int checkLookBack(int Period)
{
  if(Period >= LookBack/TimeFrame) {
    StepNext = 0;	// abort optimization
    return LookBack/TimeFrame; // reduce the period
  } else
    return Period;
}

// calculate profit factor and remove systems with not enough trades
var objective()
{
  if(NumWinTotal < 30 || NumLossTotal < 30) {
    StepNext = 0;     // abort optimization
    return 0;         // don't store this system
  } else
      return WinTotal/LossTotal; // Profit factor
}

var filter(var* Data,int Period);

void run()
{
  set(PARAMETERS|LOGFILE);
  Curves = "DailyBalance.bin";
  StartDate = 2010;
  BarPeriod = 15;
  LookBack = 80*4*24; // ~ 4 months
  Detrend = TRADES;   // detrend trade results
  while(asset(loop("EUR/USD","SPX500","XAG/USD")))
  while(algo(loop("MM15","MH1","MH4")))
  {
    TimeFrame = 1;
    if(Algo == "MH1")
      TimeFrame = 1*4;
    else if(Algo == "MH4")
      TimeFrame = 4*4;

// no trade costs
    Spread = Commission = RollLong = RollShort = Slippage = 0;

    int Periods[10] = { 10, 20, 50, 100, 200, 500, 1000, 2000, 5000, 10000 };
    int Period = Periods[round(optimize(1,1,10,1),1)-1];

    var *Price = series(price());
    var *Smoothed = series(filter(Price,Period));

    bool DoTrade = true;
    int MMIPeriod = optimize(0,200,500,100);
    if(MMIPeriod) {
      MMIPeriod = checkLookBack(MMIPeriod);
      var *MMI_Raw = series(MMI(Price,MMIPeriod));
      var *MMI_Smooth = series(LowPass(MMI_Raw,MMIPeriod));
      DoTrade = falling(MMI_Smooth);
    }

    if(DoTrade) {
      if(valley(Smoothed))
        enterLong();
      else if(peak(Smoothed))
        enterShort();
    }
  }
}
The 10 trend trading scripts with the 10 different indicators remain unchanged, aside from now including TrendMMI.c instead of Trend.c. Trading is now dependent on a boolean variable DoTrade. The length of the MMI range is varied between 200, 300, 400, and 500 bars. As most parameters in a strategy, the MMI range is a compromise: It should be no less than 200 bars for getting any accuracy, but it should not be too long for preventing that different market regimes fall in the same MMI range. At the default range of 0, no MMI is applied and trading is not filtered. This way we’re including all the previous systems in the test. This is required for properly detecting Data Mining Bias, which must consider all systems that were discarded based on their result.
We’re running the MMI return value through a lowpass filter that uses the same period as the MMI range. This gives us a smooth MMI value that does not jump around. This value is now used for trade filtering: trades are opened and closed only when the smoothed MMI is falling, meaning that the market has entered trending mode within the last 200 to 500 bars. The MMI is only applied to one of the systems resulting from the prior period variation (the optimize function automatically selects the parameter of the “most robust” system before optimizing the next parameter). So now we’re testing in fact not 900, but 1260 systems: 900 without MMI and each 90 with MMI ranges of 200, 300, 400, and 500 bars. The systems with not enough trades or a too-long lookback period are again removed from the pool, so the real number of tested systems is about 1100.
Depending on the speed of your PC, Zorro will need about 1 hour to test all systems. At the end of every system test, Zorro produces the parameter histograms. We have now two parameters. The histogram of the first one, the price smoothing filter period, looks as before because MMI was switched off during optimization. The second histogram displays the MMI range in combination with the best value from the first histogram. “Best” is here not the highest bar from the previous histogram, but the value that Zorro deems the most robust and least sensitive to market changes. A typical MMI histograms look like this:
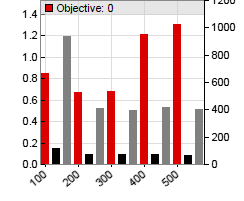
The first bar, marked “100”, is the best system without MMI. We can see that it is unprofitable: The profit factor (left scale) is only about 0.8. Using the MMI with a range of 200 and 300 makes the system in fact worse, and reduces the profit factor t0 0.7. However the last two MMI ranges, 400 and 500, shift the system into the profit zone. This was just a random example, but how does the MMI affect all the other systems? Here are the statistics from the MMI experiment:
| Asset, Period, Indicator | Success Rate | Winning | Losing |
| EUR/USD | 46% (+8%) | 154 | 185 |
| S&P 500 | 4% (+3%) | 15 | 318 |
| Silver | 27% (+7%) | 87 | 240 |
| 15 Minutes | 18% (+7%) | 71 | 322 |
| 1 Hour | 27% (+9%) | 92 | 251 |
| 4 Hours | 35% (+2%) | 93 | 170 |
| ALMA | 22% (+6)% | 22 | 79 |
| Decycle | 21% (+8%) | 23 | 89 |
| EMA | 23% (+5%) | 24 | 79 |
| HMA | 34% (+9%) | 33 | 66 |
| Laguerre | 33% (+3%) | 20 | 38 |
| LinearReg | 29% (+6%) | 31 | 77 |
| Lowpass | 24% (+5%) | 26 | 82 |
| SMA | 26% (+5%) | 27 | 76 |
| Smooth | 26% (+7%) | 23 | 67 |
| ZMA | 22% (+8)% | 27 | 90 |
The Rate column shows the percentage of successful systems, and in parentheses the difference to the percentage without MMI. We can see that the MMI increased the number of successful systems in all markets, time frames, and indicators. However the numbers are not really representative: the MMI only affected a quarter of the tested systems, but the upper quarter, so some increase in the number of profitable systems was to be expected anyway. A more meaningful measure is the WRC. We’re using the same Bootstrap.c script as in the previous experiment, we only need to increase the CURVES number to 1260. This is the WRC histogram of systems with MMI (again, best system vs. bootstrapped returns of all systems):

The MMI filter now shifted the best system (black) far to the right side of the histogram. It got a p-value of 0.02, meaning that it is better than 98% of the best randomized systems, and thus well above the 95% significance level. Using the MMI for filtering trades, the method of trading on curve peaks and valleys passed White’s Reality Check. In fact two of the 1260 systems got p-values above the significance level.
The best systems of the experiment had some things in common: They traded with silver and used either the ALMA or the lowpass filter. This is a surprising result, because neither silver nor ALMA and lowpass had the highest number of profitable systems. From the above table, one would assume that EUR/USD and the HMA or Laguerre filter are the most promising. They indeed produced many apparently good systems with profit factors above 2 (without trade costs), but none of them passed the WRC.
Conclusion
- The MMI improved trend following systems by 5%…10% average with all tested markets, time frames, and indicators. Best systems were improved by more than 50%.
- Trend following systems using the MMI can pass White’s Reality Check.
- From the 10 tested smoothing indicators, ALMA produced the best results, although within a relatively small parameter range.
- To do: Test more trend filters, f.i. the Hurst Exponent or Ehlers’ Trend/ Cycle decomposition.
- To do: Create a real trading system by combining the best trend systems and adding the usual system components such as stop loss, trailing algorithm, profit lock, money management, and so on.
I’ve added the scripts to the 2015 scripts collection.
Nice work jcl. Ciao
Hi,
All looks so good but:
if(DoTrade) {
if(valley(Smoothed))
enterLong();
else if(peak(Smoothed))
enterShort();
}
if valley or peak have a future leak you will get better, biased results. So can you show the code of
valley/peak ??
Krzysztof
You can find the code here: http://manual.zorro-project.com/peak.htm
Peeking bias won’t happen anyway with simple functions like this one, since accessing future price data would generate a warning message.
looks ok. Than i will try it to filter my 6 million trades database..
Krzysztof
Hi, i’ve traied TrendMMI script but after compiling in zorro platform received an error
TrendMMI compiling….
Undefined function called!
Train: TrendMMI 2010..2017
Loop[1][1]p1 step 1: 1.00 => 0.00 0/0
and so on.
any output/report be generated
could help me?
thanks a lot
If I remember right, TrendMMI was an #include script, not intended to be executed. You must execute one of the 10 scripts with the 10 indicators.
Hi,
I just filtered more than 2 million trades for 8 different symbols using MMI. As a result there is no impact on profit factor. More info here
http://www.trade2win.com/boards/trading-software/105880-3rd-generation-nn-deep-learning-deep-belief-nets-restricted-boltzmann-machines-35.html#post2896926
Krzysztof
I don’t think that you can get a useful result this way. Check if you can classify your trades in trend-following, trend-neutral, and counter-trend trades. MMI is for detecting trend regime, so you can not use it to just filter a bunch of trades. On pattern, cycle, or mean reversion trades it would probably even have an adverse effect. Filter the trend-following trades out of your database and then check if MMI has an effect on them. I’m interested if you get a better or worse result than the 5% advantage for simple trend systems.
Also, smoothing the MMI with the SMA is ineffective since the SMA is slow and adds an additional delay on the already slow MMI. Better use a lowpass filter. Here’s the basic code:
double LowPass(double* Buffer,double Val,double a){
double* Data = Buffer+3; // static buffer for interim results
double* LP = Buffer;
double a2 = a*a;
LP[2] = LP[1], LP[1] = LP[0]; // shift
LP[0] = (a-0.25*a2)*Val
+ 0.5*a2*Data[0]
- (a-0.75*a2)*Data[1]
+ 2*(1.-a)*LP[1]
- (1.-a)*(1.-a)*LP[2];
Data[1] = Data[0], Data[0] = Val; // shift
return LP[0];
}
General question. What is an out of sample period for 900 systems test ??? Or you just make a back test on entire data just changing the parameters and and assets ??
Krzysztof
Yes, a backtest with all parameter and asset combinations. Since the systems are not optimized, there is no in sample and therefore no out of sample period.
– Another idea: I understood that your database of trades has been generated with machine learning or data mining methods. The MMI is not suited for filtering those trades, but other functions possibly are, for instance the Shannon entropy.
Well I believe i know whats going on here. First SMA – its a low pass filter with lag (N-1)/2 and passband 2*N. Your low pass filter perhaps has a different characteristics but if the lag is a problem here i made another experiment.
whatifQAtrades_SDAE_PF=1.19_Profit=19376477035.7_PP=65.52_freq=1_tradesize=0.01_Smooth=5_Length=500_TP=279420_FP=147019
whatifQAtrades_SDAE_PF=1.18_Profit=19134217573_PP=65.51_freq=1_tradesize=0.01_Smooth=5_Length=400_TP=289835_FP=152567
whatifQAtrades_SDAE_PF=1.2_Profit=19500256790.9_PP=65.65_freq=1_tradesize=0.01_Smooth=5_Length=300_TP=289186_FP=151302
whatifQAtrades_SDAE_PF=1.19_Profit=19188274709_PP=65.46_freq=1_tradesize=0.01_Smooth=5_Length=200_TP=291564_FP=153834
whatifQAtrades_SDAE_PF=1.19_Profit=19071793097.45_PP=65.5_freq=1_tradesize=0.01_Smooth=5_Length=100_TP=288338_FP=151887
whatifQAtrades_SDAE_PF=1.19_Profit=18508067428.35_PP=65.41_freq=1_tradesize=0.01_Smooth=5_Length=50_TP=278849_FP=147459
whatifQAtrades_SDAE_PF=1.18_Profit=18796449479.8_PP=65.33_freq=1_tradesize=0.01_Smooth=5_Length=25_TP=284002_FP=150718
so I just changed the smooth to 5 to decrease the SMA lag than decreasing the Lenght to decrease lag from difference between current price and median and you can see that PF is rock solid around 1.19 reference value from full set of trades so lag is not a problem here…..
so there are two possibilities here:
1) MMI just generates the random filtering signal
2) MMI detects trend mode but somehow profit distribution within my trade file is uniform i.e. whatever you sub-sample them regardless of market conditions they show the same profit factor. This sounds very unlikely….
regarding your experiment. You created 900 systems by sending to a few systems different parameter values (MMI affected just quarter of them)
than according to your description
“The MMI is only applied to one of the systems resulting from the prior period variation (the optimize function automatically selects the parameter of the “most robust” system before optimizing the next parameter). So now we’re testing in fact not 900, but 1260 systems:
900 without MMI and each 90 with MMI ranges of 200, 300, 400, and 500 bars.The systems with not enough trades or a too-long lookback period are again removed from the pool, so the real number of tested systems is about 1100.”
so i have a feeling that you introduced selection bias here by not testing exact the same systems (900) with MMI and making final results based on this. Additionally you didn’t make any out of sample test to verify this.
Anyway, can you make out of sample test on unseen data (2016-) from your best performing systems with and without MMI and post results ??
Krzysztof
You can check if 1) or 2) is true by not applying the MMI to a collection of random trades, but to trend following trades. Either use simple systems as here, or filter them out of your database by testing the trend prior to the trade.
In this experiment there’s no selection bias because there is no selection. All tested systems were included in the WRC, including those without MMI. So it is irrelevant on how many systems the MMI was applied. This had only relevance, if any, on the statistics table with the per-asset results. There’s also some misunderstanding with ‘seen’ and ‘unseen’ data. There is no seen data since we do not optimize the systems.
The used data was from 2010-2015, and the result is thus of course only valid for this time period, not for 2016. You can not repeat it with 2016 data since you would not get a statistically relevant number of trades from only one year. What you could do is repeating the experiment with 2004-2009 data. Or wait until 2021 and then repeat it with data from 2016-2021.
MMI theory is robust enough to improve across the assets. Good Article JCL! There are some issues with the Bootstrap.c. It actually hangs the Zorro version 1.58. I tried before in the past version and it is okay. How can I go about solving it? Thanks. I will be trying out Hurst Exponent or Ehlers’ Trend/ Cycle decomposition as per your suggestion.
1.58 stored in the data in a wrong format. Use either an older version or the current zorro beta version, the bug is fixed there.
I am trying to replicate the results using the latest history. MMI is able to increase all across asset,time frame and indicator except XAU/USD and Trend EMA. Fabulous! However, the WRC actually become worse. The P-value become worse from 0.12 to 0.29. My question is why MMI can improve the winning percentage but WRC got worse and how to improve WRC?
Refer to the statistic below.
% Won without MMI/ with MMI/ Increase
H1______Percent 34.60 40.62 6.02
H4______Percent 39.77 41.58 1.81
M15_____Percent 37.14 41.75 4.61
SPX500___Percent 10.31 17.78 7.47
EUR/USD__Percent 37.18 43.50 6.32
XAG/USD__Percent 63.20 62.39 -0.81
TrendALMA___Percent 34.29 36.79 2.51
TrendDecycle___Percent 36.25 38.79 2.54
TrendEMA____Percent 37.50 37.04 -0.46
TrendHMA____Percent 36.23 47.62 11.39
TrendLaguerre_Percent 45.45 53.62 8.17
TrendLinearReg_Percent 45.07 47.66 2.59
TrendLowPass_Percent 36.49 41.82 5.33
TrendSMA____Percent 36.62 42.06 5.44
TrendSmooth__Percent 31.03 38.30 7.26
TrendZMA____Percent 30.12 34.45 4.33
Without MMI – WRC
Best of 691 systems
TrendALMA_EURUSD_H4_1_1: 1.28
Bootstrap – please wait..
Sample median: 1.24
P-Value of best strategy: 0.12
With MMI – WRC
Best of 1051 systems
TrendALMA_EURUSD_H4_1_1: 1.28
Bootstrap – please wait..
Sample median: 1.26
P-Value of best strategy: 0.29
You can see it when you compare the profit factors of the best systems. In the 2015 test, best have been the ALMA systems with XAG, at a profit factor about 3. Today ALMA is still the best, but XAG got even worse with the MMI, and the top profit factor is now 1.28. So we have to conclude that the market in the past 2 years has not been friendly to simple trend following systems, at least with those 3 assets, and the WRC consequently failed. It would be interesting to check out in more details in which way the three markets have changed in the last years.
Hello jcl,
I recently started developing systems strategies in another platform and was researching Zorro platform.
Please for give me if this is the improper location to post my (and hopefully others) concerns regarding “How to Trust the Historical Back Testing Data”
We all spend countless of hours back testing strategies all time frames (5 mins and to 1 hour for my case) and there the question that continued to circle in my head after I click back test is “Is this results accurate, how do I trust where this data is coming from”
How did you gain confidence, reliability and consistence in the backtesting historical data from your platform? Should I post this on the zorro forum?
Thank you kindly and look forward to your response as you and team have developed over 400 trading systems, so I am sure quality of historical data was examined.
I’m not sure what you mean with ‘trust’. With a few exceptions, the source of the data has little effect on test results. You only need to know what sort of data you have to use. For stocks, you must know if the data is split or dividend adjusted. For high-resolution Forex, you normally must test several times with data from several brokers since they all slightly differ. There is also data of bad quality, with gaps and outliers, which must be filtered. If this matters depends on which sort of system you want to test. The usual algo systems trade with time frames of hours or days and are not sensitive to data quality.
jcl,
Thanks for your comments.
I trade futures and mainly my experienced (day trading manually) of trading is within the intra-day (5 min charts) charts. There are not scalping (possible entry and exit are within the same bar) systems. I normally look for R:R >2 setups.
Why do you state this” The usual algo systems trade with time frames of hours or days and are not sensitive to data quality.” ? Is this because for higher time frames (above 1 hour) systems there is less likely hood for the entry and exit to be in the same bar, especially if looking for R:R >2 setups?
I am considering leaving the scalping systems development and testing cause the amount of inaccuracy between back test and real time results.
Thanks for response. I apologize if sounding confusing.
When you trade futures, you’re normally backtesting with historical data from an exchange, not from a broker. This means that there are maybe different data vendors, but no different data sources. The only differences between vendors are the data format and the processing for fixing outliers and other issues.
Higher time frames exploit larger price changes. Large price changes mean that tiny differences don’t matter. There are many effects that will cause differences between backtest and live results, but the data is normally not one of them.
Thank you jcl,
What time frames do you recommend newbies automated strategy developers to begin on?
I have experience with intra day swings trading (1 to 2 trades per day).
I have never swing (held trades overnight or for day)trade before .
But I’m willing to change of it makes this process more achievable with having to worry on so much false results.
Thank you
Swing trading is ok. I recommend time frames of 1 hour or above. Below 1 hour, it becomes difficult and takes experience to achieve profit and to properly backtest systems.
Thank you very much jcl for response. Really appreciate it.
Hi, what is your definition of falling in the code above. Is falling testing to see if MMI is below a threshold of 75% or is falling testing that the slope of the MMI is negative i.e. sloping in a downward direction (\) or is falling testing both that both of the mentioned conditions are true. Thanks
Falling is simply a negative slope.
Interesting results.
Have any similar experiments been conducted on Bitcoin to determine if it has similar “currency” characteristics?
Thanks,
Mark
Yes. Bitcoin does not behave like a currency, but trend is present.
I’ve tried replicating these results by placing the line “EndDate = 20150901;” in the TrendMMI.c file (in 2015 Scripts archive) and running both the TrendTest.bat file, followed by BoostrapMMI.c
Unfortunately, even with the date constraints, the “Best” system is Strategy\TrendHMA.c_XAG/USD_H4_1_1: 1.28, with a Sample median of 1.28 and a P-Value of best strategy 0.41.
Any idea as to the discrepancy between the blog article and my results?
No, but someting is obviously different. If it’s not the historical data, then asset parameters or something in the software have changed since that article from 4 years ago. I will look into that, and run the test again in the next time with current parameters. I’ll post here what I find.
Ok sounds fantastic, thank you
This post is pure gold!! Thank you so much for all the effort and for sharing. For those paying attention, there’s thousands if not tens or hundreds of thousands of dollars in this post alone. Awesome stuff… Now I’m going digging to see if i can any other experiments run over 900 different systems and found to consistently improve them!! (Would love to see one that increases the likelyhood of a mean reversion strategy working)