
Perry Kaufman, known for his technical indicators bible, presented in TASC 1/24 a trading strategy based on upwards and downwards gaps. For his system, he invented the Gap Momentum Indicator (GAPM). Here I’m publishing the C version of his indicator, and a simple trading system based on it. Continue reading “The Gap Momentum System”
High-Conviction Trading
In the TASC September issue, Alfred Tagher presented a new indicator based on the Commitment Of Traders (COT) report. This report is available on the NASDAQ website. It is released weekly by the Commodities Futures Trading Commission and reflects the activities of various groups of commercial and noncommercial traders. Evaluating this report allows trading systems to automatically follow the “smart money”.
Continue reading “High-Conviction Trading”
Undersampling
All the popular ‘smoothing’ indicators, like SMA or lowpass filters, exchange more lag for more smoothing. In TASC 4/2023, John Ehlers suggested the undersampling of price curves for achieving a better compromise between smoothness and lag. We will check that by applying a Hann filter to the original price curve and to a 5-fold undersampled curve. Continue reading “Undersampling”
Open or Close? Why Not Both?
In his TASC February 2023 article, John Ehlers proposed to use the average of open and close, rather than the close price, for technical indicators. The advantage is a certain amount of noise reduction. On intraday bars the open-close average is similar to an SMA(2). It makes the data a bit smoother, but at cost of additional lag by half a bar. Continue reading “Open or Close? Why Not Both?”
Trading with REST

Many brokers and exchanges can nowadays be accessed online with a REST API that communicates with plain-text HTTP requests. The days of awkward proprietary broker APIs are coming to an end. This article is a step by step instruction of implementating a REST API interface in C for connecting a trading system to the Bittrex cryptocurrency exchange. It’s for the Zorro platform, but the principles are also valid for other exchanges and platforms. The C code for a basic REST API implementation is relatively short and straightforward. Continue reading “Trading with REST”
The Linear Regression-Adjusted Exponential Moving Average
There are already uncounted variants of moving averages. Vitali Apirine invented another one in his article in the Stocks&Commodities September issue. The LREMA is an EMA with a variable period derived from the distance of the current price and a linear regression line. This ensures an optimal EMA period at any point – at least in theory. Will this complex EMA variant beat the standard EMA for detecting trend changes?
Continue reading “The Linear Regression-Adjusted Exponential Moving Average”
Ehlers Loops
Price charts normally display price over time. Or in some special cases price over ranges or momentum. In his TASC articles in June and July 2022, John Ehlers proposed a different way of charting. The relation of two parameters, like price over momentum, or price A over price B, is displayed as a 2D curve in a scatter plot. The resulting closed or open loop is supposed to predict the future price development. Of course only if interpreted in the right way.
Never Sell in May!
“Sell in May and go away” is an old stock trader’s wisdom. But in his TASC May 2022 article, Markos Katsanos examined that rule in detail and found that it should rather be “Sell in August and buy back in October”. Can trading be really this easy? Let’s have a look at the simple seasonal trading rule and a far more complex application of it.
Why 90% of Backtests Fail
About 9 out of 10 backtests produce wrong or misleading results. This is the number one reason why carefully developed algorithmic trading systems often fail in live trading. Even with out-of-sample data and even with cross-validation or walk-forward analysis, backtest results are often way off to the optimistic side. The majority of trading systems with a positive backtest are in fact unprofitable. In this article I’ll discuss the cause of this phenomenon, and how to fix it. Continue reading “Why 90% of Backtests Fail”
The Relative Vix Strength Exponential Moving Average
The exponential moving average (EMA) and the Relative Strength Indicator (RSI) are both very popular and useful indicators for algorithmic trading. So why no glue both together to get an even better indicator? That was the basic idea of Vitali Apirine’s TASC 3/2022 article. We’re measuring the relative strength of a volatility index (VIX), and use the result as an EMA time period. Do we now have the ultimate indicator to beat them all?
Continue reading “The Relative Vix Strength Exponential Moving Average”
The Inverse Fisher Transform
The Fisher Transform converts data to or from a Gaussian distribution. It was first used in algorithmic trading by John Ehlers (1) , and became a common part of indicators since then. In a TASC February 2022 article, Ehlers described a new indicator, the Elegant Oscillator, based on the Inverse Fisher Transform. Let’s have a look at this indicator and how it’s used in a trading system.
Yet Another Improved RSI
John Ehlers strikes again. The TASC January 2022 issue features another indicator supposedly improved with Hann windowing – the RSIH, a RSI with Hann flavour. Can it beat the standard RSI?
The COVID survival calculator
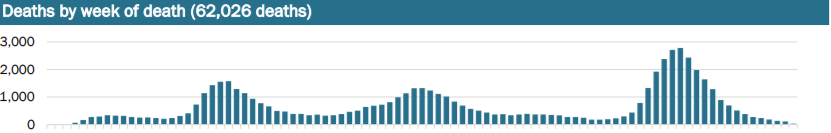
Trading is obviously affected by global pandemics. Not only because markets tank whenever a new virus variant emerges. It’s also personal. After all, if you know that you have only a few months before you likely die, you might be motivated to trade a little more risky. To help you with this decision, I’m publishing here a Zorro script that calculates your average survival time depending on the COVID incidence in your country and on your vaccination status. Continue reading “The COVID survival calculator”
The MAD indicator
As an application to the windowing technique described the the previous article, John Ehlers proposed a new trend indicator that he claimed is robust and yet simple. The latter is certainly true, as the MAD (Moving Average Difference) oscillator is, as the name says, just the difference of two moving averages normalized to +/-100. Continue reading “The MAD indicator”
Better Indicators with Windowing
If indicators didn’t help your trading so far, just pimp them by preprocessing their input data. John Ehlers proposed in his TASC September article the windowing technique: multiply the input data with an array of factors. Let’s see how triangle, Hamming, and Hann factor arrays can improve the SMA indicator.
Moving Average Bands
Compared to plain indicators, bands have the advantage that they look more colorful on charts. And they offer more lines to trigger trade signals. In this way, bands beat any old single-line indicator hands down. This was also noticed by Vitali Apirine, who invented in the Stocks&Commodities August 2021 issue a new sort of bands.
Buy&Hold? No, Buy&Sell!
There’s no doubt that buying and holding index ETFs is a long-term profitable strategy. But it has two problems. It does not reinvest profits, so the capital grows only linearly, not exponentially. And it exposes the capital to the full rollercoaster market risk. A sure way to go out of the market in a downtrend, and invest the profits back in an uptrend would be (almost) priceless. Markos Katsanos promises no less in his Stocks&Commodities July 2021 article. Does this really work? Continue reading “Buy&Hold? No, Buy&Sell!”
More Robust Strategies
The previous article dealt with John Ehlers’ AM and FM demodulating technology for separating signal and noise in price curves. In the S&C June issue he described a practical example. Applying his FM demodulator makes a strategy noticeably more robust – at least with parameter optimization.
The Price Wave Radio
Price curves consist of much noise and little signal. For separating the latter from the former, John Ehlers proposed in the Stocks&Commodities May 2021 issue an unusual approach: Treat the price curve like a radio wave. Apply AM and FM demodulating technology for separating trade signals from the underlying noise. Continue reading “The Price Wave Radio”
Detecting Volume Breakouts
It is estimated that about 6000 different technical indicators have been meanwhile published, but few of them are based on volume. In his article in Stocks & Commodities April 2021, Markos Katsanos proposed a new indicator for detecting high-volume breakouts. And he tested it with a trading system that I believe is the most complex one ever posted on this blog.
The Trend Persistence Indicator
Financial markets are not stationary: Price curves swing all the time between trending, mean reverting, or entirely random behavior. Without a filter for detecting trend regime, any trend following strategy will bite the dust sooner or later. In Stocks & Commodities February 2021, Richard Poster proposed a trend persistence indicator for avoiding unprofitable market periods.
Monetize Alternative Facts!

After last week’s events, major social media companies made another attempt at saving humanity. Twitter and Facebook booted Trump and some of his enablers, Google and Apple cancelled Parler. But is censorship the right way to stem the swell of disinformation, postfactuality, dislocation from reality? I think not. Here’s a better solution. And you can even use it to earn some extra dollars. Continue reading “Monetize Alternative Facts!”
Petra on Programming: Short-Term Candle Patterns
Japanese rice merchants invented candle patterns in the eighteenth century. Some traders believe that those patterns are still valid today. But alas, it seems no one yet got rich with them. Still, trading book authors are all the time praising patterns and inventing new ones, in hope to find one pattern that is really superior to randomly entering positions. In the Stocks & Commodities January 2021 issue, Perry Kaufman presented several new candle patterns. Let’s repeat his pattern tests with major US stocks and indices, and with or without an additional trend filter. Continue reading “Petra on Programming: Short-Term Candle Patterns”
Petra on Programming: Get Rid of Noise
A major problem of indicator-based strategies is that most indicators produce more or less noisy output, resulting in false signals. The faster the indicator reacts on market situations, the noisier is it usually. In the S&C December issue, John Ehlers proposed a de-noising technology based on correlation. Compared with a lowpass filter, this method does not delay the signal. As an example, we will apply the noise elimination to Ehlers’ MyRSI indicator, a RSI variant that he presented in an earlier article. Continue reading “Petra on Programming: Get Rid of Noise”
“Please Send Me a Trading System!”

“It should produce 150 pips per week. With the best indicators that you know. How much does it cost? Please also send live histories of your top systems.”
Although we often get such requests, we still don’t know the best indicators and can’t send live histories. We do not invent algo trading systems, but program them from clients’ specifications. And we do not trade them, except for testing. But after almost 1000 systems, we can see a pattern emerging. Which algo trading strategies do usually work? Which will fall apart already in the backtest? Here’s a ranking of all systems we did so far, with a surprising winner. Continue reading ““Please Send Me a Trading System!””
Petra on Programming: The Gann Hi-Lo Activator
Fortunately I could write this article without putting my witch hat on. Despite its name, the ‘Gann Hi-Lo Activator’ was not invented by the famous esotericist, but by Robert Krausz in a 1998 article in the Stocks&Commodities magazine. In a recent article, Barbara Star combined it with other indicators for a swing trading system. Will an indicator with the name ‘Gann’ work outside the realm of the supernatural? Continue reading “Petra on Programming: The Gann Hi-Lo Activator”
Petra on Programming: Four Dimensions of Strength
In the S&C September 2020 article “Tracking Relative Strength In Four Dimensions”, James Garofallou presents a metric for evaluating a security’s strength relative to 11 major market sectors and over several time periods. All this information is squeezed into a single value. Maybe at cost of losing other important information? In this article we’ll look into how to program such a beast, and how it fares when we use it for rebalancing a stock portfolio. Continue reading “Petra on Programming: Four Dimensions of Strength”
Petra on Programming: The Compare Price Momentum Oscillator
Vitali Apirine, inventor of the OBVM indicator, presented another new tool for believers in technical analysis. His new Compare Price Momentum Oscillator (CPMO), described in the Stocks & Commodities August 2020 issue, is based on the Price Momentum Oscillator (PMO) by Carl Swenlin. Yet another indicator with an impressive name. But has it any use? Continue reading “Petra on Programming: The Compare Price Momentum Oscillator”
Petra on Programming: Truncated Indicators
Cumulative indicators, such as the EMA or the MACD, are affected by a theoretically infinite history of candles. In finite backtests, these indicators return slightly different results depending on the test period. This effect is often assumed negligible. But John Ehlers demonstrated in his July S&C article that it is not so. At least not for some indicators, such as a narrow bandpass filter. We have to truncate the indicator’s ‘internal history’ for getting consistent results. How do we do that in C? Continue reading “Petra on Programming: Truncated Indicators”
Petra on Programming: The Correlation Cycle Indicator
The previous article dealt with indicators based on correlation with a trend line. This time we’ll look into another correlation-based indicator by John Ehlers. The new Correlation Cycle indicator (CCY) measures the price curve correlation with a sine wave. This works surprisingly well – not for generating trade signals, but for a different purpose.
Continue reading “Petra on Programming: The Correlation Cycle Indicator”
Petra on Programming: A Unique Trend Indicator
This months project is a new indicator by John Ehlers, first published in the S&C May 2020 issue. Ehlers had a unique idea for early detecting trend in a price curve. No smoothing, no moving average, but something entirely different. Lets see if this new indicator can rule them all.
Continue reading “Petra on Programming: A Unique Trend Indicator”
Petra on Programming: The Smoothed OBV
In his article in the S&C April 2020 issue, Vitali Apirine proposed a modified On Balance Volume indicator (OBVM). The hope was that OBVM crossovers and divergences make great trade signals, especially for stock indices. I got the job to put that to the test.
The Scholz Brake: Fixing Germany’s New 1000% Trader Tax

Would you like to read – from begin to end – a 18 page pounderous law draft titled “Law for introducing a duty to report cross-border tax structuring”? The members of the German Bundestag apparently didn’t. After all, nothing seemed wrong with a duty to report cum-ex schemes. So the new law, proposed by finance minister Olaf Scholz, passed legislation on December 12, 2019 without much discussion. Only afterwards its real content, hidden on page 15, became public. It caused incredulity and turmoil among traders and investors. This article deals with the new bizarre German ‘trader tax’, and with ways to step around it. Continue reading “The Scholz Brake: Fixing Germany’s New 1000% Trader Tax”
Petra on Programming: A New Zero-Lag Indicator
I was recently hired to code a series of indicators based on monthly articles in the Stocks & Commodities magazine, and to write here about the details of indicator programming. Looking through the magazine, I found many articles useful, some a bit weird, some a bit on the esoteric side. So I hope I won’t have to code Elliott waves or harmonic figures one day. But this first one is a very rational indicator invented by a famous algo trader.
Continue reading “Petra on Programming: A New Zero-Lag Indicator”
The Mechanical Turk

We can see thinking machines taking over more and more human tasks, such as car driving, Go playing, or financial trading. But sometimes it’s the other way around: humans take over jobs supposedly assigned to thinking machines. Such a job is commonly referred to as a Mechanical Turk in reminiscence to Kempelen’s famous chess machine from 1768. In our case, a Mechanical Turk is an automated trading algorithm based on human intelligence. Continue reading “The Mechanical Turk”
Deep Learning Systems for Bitcoin 1

Since December 2017, bitcoins can not only be traded at more or less dubious exchanges, but also as futures at the CME and CBOE. And already several trading systems popped up for bitcoin and other cryptocurrencies. None of them can claim big success, with one exception. There is a very simple strategy that easily surpasses all other bitcoin systems and probably also all known historical trading systems. Its name: Buy and Hold. In the light of the extreme success of that particular bitcoin strategy, do we really need any other trading system for cryptos? Continue reading “Deep Learning Systems for Bitcoin 1”
Algorithmic Options Trading 3

In this article we’ll look into a real options trading strategy, like the strategies that we code for clients. This one however is based on a system from a trading book. As mentioned before, options trading books often contain systems that really work – which can not be said about day trading or forex trading books. The system examined here is indeed able to produce profits. Which is not surprising, since it apparently never loses. But it is also obvious that its author has never backtested it. Continue reading “Algorithmic Options Trading 3”
Hacking a HFT system

Compared with machine learning or signal processing algorithms of conventional algo trading strategies, High Frequency Trading systems can be surprisingly simple. They need not attempt to predict future prices. They know the future prices already. Or rather, they know the prices that lie in the future for other, slower market participants. Recently we got some contracts for simulating HFT systems in order to determine their potential profit and maximum latency. This article is about testing HFT systems the hacker’s way. Continue reading “Hacking a HFT system”
Algorithmic Options Trading 2
In this second part of the Algorithmic Options trading series we’ll look more closely into option returns. Especially into combining different option types for getting user-tailored profit and risk curves. Option traders know combinations with funny names like “Iron Condor” or “Butterfly”, but you’re not limited to them. With some tricks you can create artificial financial instruments of any desired property – for instance “Binary Options” with more than 100% payout factor. Continue reading “Algorithmic Options Trading 2”
Bye Yahoo, and thanks for all the fish
Just a quick post in the light of a very recent event. Users of financial functions of R, MatLab, Python, or Zorro got a bad surprise in the last days. Scripts and programs based on historical price data suddenly didn’t work anymore. And our favorite free historical price data provider, Yahoo, now responds on any access to their API in this way:
Algorithmic Options Trading 1
Despite the many interesting features of options, private traders rarely take advantage of them (of course I’m talking here of serious options, not binary options). Maybe options are unpopular due to their reputation of being complex. Or because they are unsupported by most trading software. Or due to the price tags of the few options trading tools and of the historical data that you need for algorithmic trading. Whatever – we recently did several programming contracts for algorithmic options trading systems, and I was surprised that even simple systems seemed to produce relatively consistent profit. Especially selling options appears more lucrative than trading ‘conventional’ instruments. This article is the first one of a mini-series about earning money with algorithmic options trading. Continue reading “Algorithmic Options Trading 1”
Better Strategies 5: A Short-Term Machine Learning System

It’s time for the 5th and final part of the Build Better Strategies series. In part 3 we’ve discussed the development process of a model-based system, and consequently we’ll conclude the series with developing a data-mining system. The principles of data mining and machine learning have been the topic of part 4. For our short-term trading example we’ll use a deep learning algorithm, a stacked autoencoder, but it will work in the same way with many other machine learning algorithms. With today’s software tools, only about 20 lines of code are needed for a machine learning strategy. I’ll try to explain all steps in detail. Continue reading “Better Strategies 5: A Short-Term Machine Learning System”
Get Rich Slowly

Most trading systems are of the get-rich-quick type. They exploit temporary market inefficiencies and aim for annual returns in the 100% area. They require regular supervision and adaption to market conditions, and still have a limited lifetime. Their expiration is often accompanied by large losses. But what if you’ve nevertheless collected some handsome gains, and now want to park them in a more safe haven? Put the money under the pillow? Take it into the bank? Give it to a hedge funds? Obviously, all that goes against an algo trader’s honor code. Here’s an alternative. Continue reading “Get Rich Slowly”
Binary Options: Scam or Opportunity?

We’re recently getting more and more contracts for coding binary option strategies. Which gives us a slightly bad conscience, since those options are widely understood as a scheme to separate naive traders from their money. And their brokers make indeed no good impression at first look. Some are regulated in Cyprus under a fake address, others are not regulated at all. They spread fabricated stories about huge profits with robots or EAs. They are said to manipulate their price curves for preventing you from winning. And if you still do, some refuse to pay out, and eventually disappear without a trace (but with your money). That’s the stories you hear about binary options brokers. Are binary options nothing but scam? Or do they offer a hidden opportunity that even their brokers are often not aware of? Continue reading “Binary Options: Scam or Opportunity?”
Better Strategies 4: Machine Learning
Deep Blue was the first computer that won a chess world championship. That was 1996, and it took 20 years until another program, AlphaGo, could defeat the best human Go player. Deep Blue was a model based system with hardwired chess rules. AlphaGo is a data-mining system, a deep neural network trained with thousands of Go games. Not improved hardware, but a breakthrough in software was essential for the step from beating top Chess players to beating top Go players.
In this 4th part of the mini-series we’ll look into the data mining approach for developing trading strategies. This method does not care about market mechanisms. It just scans price curves or other data sources for predictive patterns. Machine learning or “Artificial Intelligence” is not always involved in data-mining strategies. In fact the most popular – and surprisingly profitable – data mining method works without any fancy neural networks or support vector machines. Continue reading “Better Strategies 4: Machine Learning”
Build Better Strategies! Part 3: The Development Process
This is the third part of the Build Better Strategies series. In the previous part we’ve discussed the 10 most-exploited market inefficiencies and gave some examples of their trading strategies. In this part we’ll analyze the general process of developing a model-based trading system. As almost anything, you can do trading strategies in (at least) two different ways: There’s the ideal way, and there’s the real way. We begin with the ideal development process, broken down to 10 steps. Continue reading “Build Better Strategies! Part 3: The Development Process”
Dear Brokers…
Whatever software we’re using for automated trading: We all need some broker connection for the algorithm to receive price quotes and place trades. Seemingly a simple task. And almost any broker supports it through a protocol such as FIX, through an automated platform such as MT4™, or through a specific broker API. But if you think you can quickly hook up your trading software to a broker API, you’re up for a bad surprise. Dear brokers – please read this post and try to make hacker’s and coder’s lifes a little easier! Continue reading “Dear Brokers…”
Build Better Strategies! Part 2: Model-Based Systems
Trading systems come in two flavors: model-based and data-mining. This article deals with model based strategies. Even when the basic algorithms are not complex, properly developing them has its difficulties and pitfalls (otherwise anyone would be doing it). A significant market inefficiency gives a system only a relatively small edge. Any little mistake can turn a winning strategy into a losing one. And you will not necessarily notice this in the backtest. Continue reading “Build Better Strategies! Part 2: Model-Based Systems”
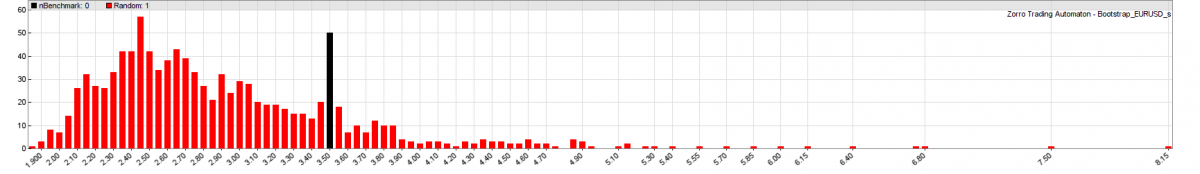
Better Tests with Oversampling

The more data you use for testing or training your strategy, the less bias will affect the test result and the more accurate will be the training. The problem: price data is always in short supply. Even shorter when you must put aside some part for out-of-sample tests. Extending the test or training period far into the past is not always a solution. The markets of the 1990s or 1980s were very different from today, so their price data can cause misleading results.
In this article I’ll describe a simple method to produce more trades for testing, training, and optimizing from the same amount of price data. The method is tested with a price action system based on data mining price patterns. Continue reading “Better Tests with Oversampling”
Build Better Strategies!
Enough blog posts, papers, and books deal with how to properly optimize and test trading systems. But there is little information about how to get to such a system in the first place. The described strategies often seem to have appeared out of thin air. Does a trading system require some sort of epiphany? Or is there a systematic approach to developing it?
This post is the first of a small series in which I’ll attempt a methodical way to build trading strategies. The first part deals with the two main methods of strategy development, with market hypotheses and with a Swiss Franc case study. Continue reading “Build Better Strategies!”